Lead Gen KPIs: A Practical Guide to Lead Gen KPIs That Scale Your Pipeline

By Mriganka Bhuyan
•Founder at Munch
Lead gen KPIs are the numbers that tell you if your efforts to attract new customers are actually working. They're your compass for predictable growth, showing you whether you're creating real sales opportunities or just making a lot of digital noise.
Moving Beyond Vanity Metrics in Lead Generation
Welcome to the jungle of sales metrics. It's incredibly easy to get tangled in charts and graphs celebrating numbers that feel good but don't actually move the needle. This is the classic trap: mistaking busy work for business growth.
Too many teams fall for vanity metrics, things like website traffic or social media followers. It's the business equivalent of getting a million views on a TikTok dance when you’re trying to sell enterprise software. The numbers are huge, but is the audience actually buying?
Focusing on the right lead gen KPIs, on the other hand, is like having a cheat code for predictable revenue. It forces you to look past the surface-level fluff and zero in on the insights that directly fatten your bottom line.
Think of it this way: Actionable KPIs are tied to real pipeline and sales outcomes. Vanity metrics just reflect clicks and eyeballs without any context. This pyramid says it all: revenue is the ultimate goal at the top, supported by the solid foundation of actionable KPIs. Vanity metrics? They're the shaky base at the very bottom.
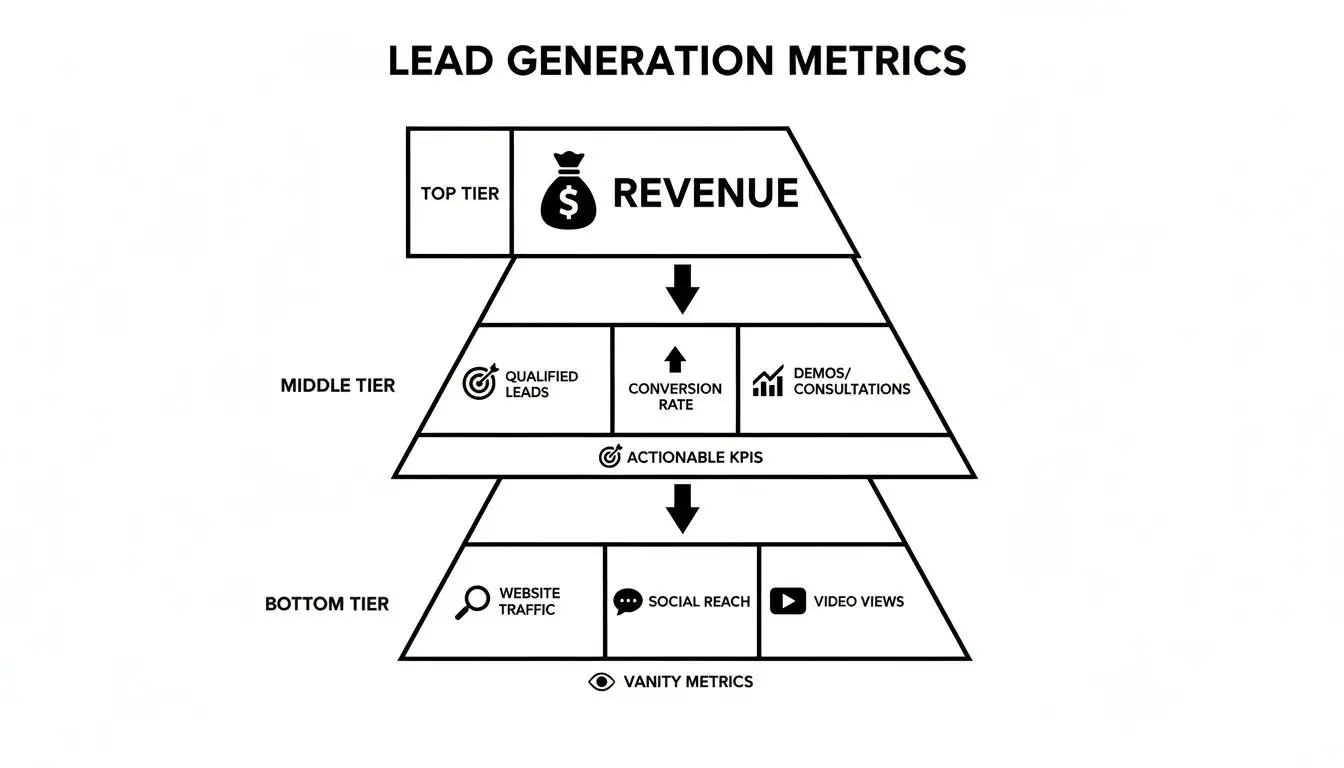
The takeaway here is simple but powerful: every metric you track should ultimately serve the goal of generating revenue. Actionable KPIs are your direct flight to that destination.
Actionable KPIs vs. Vanity Metrics
So, how do you separate the real signals from all the noise? It boils down to knowing which numbers tell the true story of your business's health and which ones are just pretty distractions.
-
Vanity Metrics: These are the numbers that look impressive in a report but have a weak link to sales. Think page views, email open rates, or social media likes. Getting 10,000 website visitors is a classic vanity metric if not a single one becomes a lead.
-
Actionable KPIs: These are the metrics that connect your marketing and sales efforts directly to business outcomes. We're talking MQL-to-SQL conversion rate, pipeline created, or cost per meeting. These are the numbers that fuel smart decisions and help you scale.
The real goal isn't just to generate leads; it's to generate qualified leads efficiently. An actionable KPI tells you if a lead is likely to buy, while a vanity metric just tells you they looked. Knowing the difference is fundamental to building a powerful sales engine.
To take it a step further, the best teams implement a scoring system to identify which leads have the highest potential to convert. You can dive into proven strategies for this in our guide on lead scoring best practices. This approach ensures your sales team focuses its precious energy only on the opportunities that are most likely to close.
Your Lead Gen KPI Cheat Sheet
To make this crystal clear, here's a quick cheat sheet. Keep this handy to make sure you're always tracking the numbers that matter most for pipeline and revenue growth.
| Metric Category | Vanity Metric (Looks Good) | Actionable KPI (Drives Revenue) | Why It Matters |
|---|---|---|---|
| Website Performance | Total Website Traffic | Lead Conversion Rate | Shows if your site is just attracting browsers or actually converting buyers. |
| Email Outreach | Email Open Rate | Reply/Response Rate | An open is nice, but a reply is a real conversation starter and a sign of interest. |
| Content Engagement | Social Media Likes/Followers | Meetings Booked from Content | Likes don't pay the bills; meetings booked from a blog post or webinar do. |
| Lead Quality | Total Number of Leads | Marketing Qualified to Sales Qualified Lead (MQL→SQL) Rate | Measures whether you're generating high-intent leads that sales can actually work. |
| Financials | Overall Marketing Budget | Cost Per Lead (CPL) / Cost Per Acquisition (CPA) | Tells you how efficiently your dollars are turning into qualified leads and new customers. |
Remember, what gets measured gets managed. By focusing on the "Actionable KPI" column, you're not just tracking activity, you're actively steering your team toward revenue.
Measuring Your Top of Funnel Success
Alright, let's get into the nitty-gritty. We're talking about the metrics that separate the sales legends from the rookies just hoping for a miracle. Your top-of-funnel is where first impressions are made, and if you mess this up, you’ll have nothing but digital tumbleweeds rolling through your CRM. Get it right, and you’re building a pipeline that actually keeps the lights on.
Think of these foundational lead-gen KPIs as your early warning system. They're the blinking lights on your dashboard telling you if your outreach is hitting the mark or just shouting into the void.
Lead Volume
First up, the most straightforward metric of them all: Lead Volume. This is simply the raw count of new leads you generate over a specific time frame, like a week, a month, or a quarter. It's the headcount of every person who raised their hand, even for a second, showing a flicker of interest.
Now, it’s easy to dismiss this as a vanity metric, but don't. A sudden drop could be the first sign your latest ad campaign is a dud, while a huge spike could mean your new ebook is a certified hit. It’s the pulse check for all your top-of-funnel activities.
-
Formula: Total number of new leads in a given period.
-
Example: Your SDR team sources 250 new contacts in a week, and your website form captures another 50 sign-ups. Your total Lead Volume for that week is 300. Simple as that.
Visitor to Lead Conversion Rate
Okay, now we're getting warmer. Your Visitor to Lead Conversion Rate tells you what percentage of people who land on your website actually become a lead. Did they fill out a form? Sign up for your newsletter? Download that whitepaper you spent weeks on? This is where you find out if your website is just a pretty brochure or a genuine lead-generating machine.
A high conversion rate is a beautiful thing because it means your website copy, calls-to-action, and overall user experience are all working together. A low rate, on the other hand, is a massive red flag that something is scaring people away. If you're struggling to figure out what's wrong, you might need to dig into how to track website visitors to see exactly where they’re bailing.
-
Formula: (Number of New Leads ÷ Number of Unique Website Visitors) x 100
-
Example: Your website gets 10,000 unique visitors in a month. During that time, 200 of them fill out your "Request a Demo" form. Your Visitor to Lead Conversion Rate is a solid 2%.
Dashboards like this are perfect for visualizing how your channels are performing and where your best leads are coming from.
At a glance, you can see if organic search is outperforming your paid ads, helping you make smarter decisions about where to put your money.
MQL to SQL Rate
This one is huge. The MQL to SQL Rate tracks the percentage of Marketing Qualified Leads (MQLs) that your sales team actually accepts as Sales Qualified Leads (SQLs). This is the official handoff metric, the moment where marketing passes the baton to sales.
A high MQL to SQL rate means your teams are perfectly in sync, like a flawless buddy cop duo from a 90s action flick. But a low rate? That suggests they're working against each other. You've got marketing tossing any and every lead over the fence while sales complains about all the junk they have to sift through. Getting this number up is one of the fastest ways to boost sales efficiency.
-
Formula: (Number of SQLs ÷ Number of MQLs) x 100
-
Example: Marketing proudly delivers 100 MQLs this month. After a thorough review, the sales team gives the thumbs-up to 20 of them as legitimate opportunities. Your MQL to SQL rate is 20%.
Initial Reply Rate
For any outbound team, this is the moment of truth. The Initial Reply Rate measures the percentage of prospects who actually respond to your first cold touchpoint, whether that’s an email or a LinkedIn message. No response means no conversation.
A high reply rate tells you two things: your targeting is sharp, and your messaging is compelling enough to cut through the noise. A low one means you're probably landing in the spam folder or, even worse, being ignored.
Chasing sheer lead volume is a losing game. It’s all about the conversion rates that turn prospects into pipeline. The best teams know that quality trumps quantity every single time.
Industry benchmarks often place the average SQL conversion rate between 15% and 25%, which just goes to show how critical lead quality is from the very start.
-
Formula: (Number of Unique Replies ÷ Number of Prospects Contacted) x 100
-
Example: An SDR sends a killer personalized email sequence to 500 prospects. Over the next week, 40 of them hit reply. The Initial Reply Rate for that campaign is 8%.
Turning Conversations Into Revenue and Pipeline
A busy top-of-funnel is nice, but activity doesn't pay the bills. Pipeline does.
This is where we graduate from the hopeful handshakes of early engagement to the metrics that actually make your CFO sit up and listen. These are the lead gen KPIs that have a direct, undeniable line to signed contracts and cash in the bank.
If the first set of metrics was about starting conversations, these are about turning those chats into cold, hard revenue. This is where the real magic happens, separating the sales teams that are just busy from the ones that are building an empire.
Let's get into the numbers that prove your sales engine isn't just running, it's winning the race.
Meeting Booked Rate
This one's simple but speaks volumes. The Meeting Booked Rate tells you what percentage of your qualified leads are actually intrigued enough to schedule a call. A high rate is a beautiful thing; it means your value prop is landing perfectly and your outreach is hitting all the right pain points.
A low rate, on the other hand, is a blaring alarm. It signals a major disconnect. Either you're barking up the wrong tree (bad targeting) or your message is so weak it can't convince someone to give you 30 minutes of their day. It’s the ultimate litmus test for prospect intent.
-
Formula: (Number of Meetings Booked ÷ Number of Qualified Leads) x 100
-
Example: Your SDR team qualifies 50 leads in a month and gets 10 of them to book a demo. Your Meeting Booked Rate is a solid 20%.
Cost Per Lead (CPL)
Alright, time to talk money. Cost Per Lead (CPL) is exactly what it sounds like: how much you’re shelling out to get a single lead in the door. It's a critical efficiency metric that keeps your marketing budget honest and stops you from pouring cash into a black hole.
But be warned: CPL has a dark side. A low CPL looks fantastic on a spreadsheet, but it's completely useless if those "cheap" leads are junk. It’s like buying a thousand lottery tickets for a penny each. Sure, your cost per ticket is low, but you’re still not going to win.
A $10 lead that never books a meeting is infinitely more expensive than a $100 lead that turns into a $10,000 deal. Focusing on CPL without considering lead quality is a classic rookie mistake.
Imagine you spend $2,000 on a LinkedIn ad campaign and generate 20 leads. Your CPL is a tidy $100. But if none of those leads book a meeting, your Cost Per Meeting is infinity. And infinity is a very lonely, very expensive number.
-
Formula: (Total Marketing Spend ÷ Total New Leads)
-
Example: You spend $5,000 on a webinar and get 250 registrants who fit your ICP. Your CPL for that campaign is $20.
Pipeline Created
This is it. The king of all lead gen KPIs. Pipeline Created is the total dollar value of all the qualified opportunities your team has generated. It's the most direct measure of your lead generation's impact on future revenue.
When your CEO asks, "How's sales going?" this is the number you lead with. It’s not about call volume or email stats; it’s about how much potential revenue you’ve put on the board. Building a solid sales pipeline is the bedrock of predictable growth, and this KPI tells you exactly how strong that foundation is. For a deeper dive, check out our guide on how to build a sales pipeline that actually delivers.
-
Formula: Sum of the value of all qualified opportunities created in a period.
-
Example: Your team generates 5 SQLs this month. One is worth $50k, two are worth $25k each, and two are worth $10k each. Your total Pipeline Created for the month is $120,000.
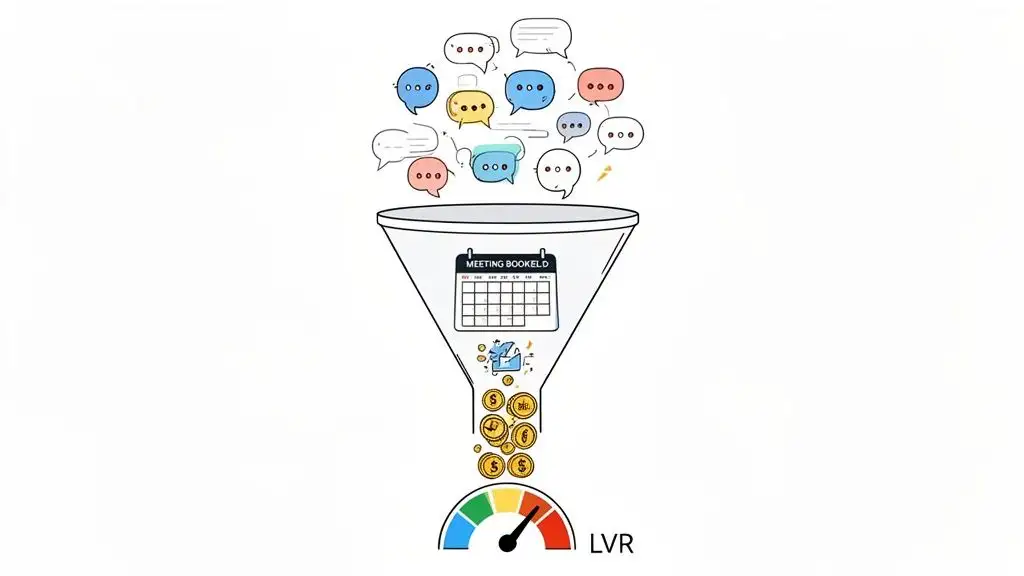
Lead Velocity Rate (LVR)
If Pipeline Created is a snapshot of your current success, Lead Velocity Rate (LVR) is the speedometer for your sales engine. It measures the month-over-month growth of your qualified leads, telling you how fast your opportunity-generating machine is accelerating.
Think of it this way: LVR is the Dominic Toretto of your metrics because it's all about living your life a quarter-mile (or fiscal quarter) at a time, and always, always moving faster. A rising LVR is one of the healthiest signs for a business, signaling to everyone from your board to your newest SDR that you're on a powerful growth trajectory.
-
Formula: ((Number of Qualified Leads This Month - Number of Qualified Leads Last Month) ÷ Number of Qualified Leads Last Month) x 100
-
Example: You generated 100 qualified leads last month and 125 this month. Your LVR is 25%. Your pipeline is picking up speed.
Optimizing Your Lead Gen KPIs by Channel
Let's be honest, not all channels are created equal. Trying to judge your email campaign's success with the same ruler you use for LinkedIn is like comparing a finely crafted espresso to a Red Bull. They both give you a jolt, but they're playing entirely different games.
To get a real grip on what’s working, you have to get specific. Let's dig into the essential KPIs for the big three in B2B: Email, LinkedIn, and Paid Ads. This is how you stop flying blind and start making channel-specific tweaks that actually grow your pipeline.
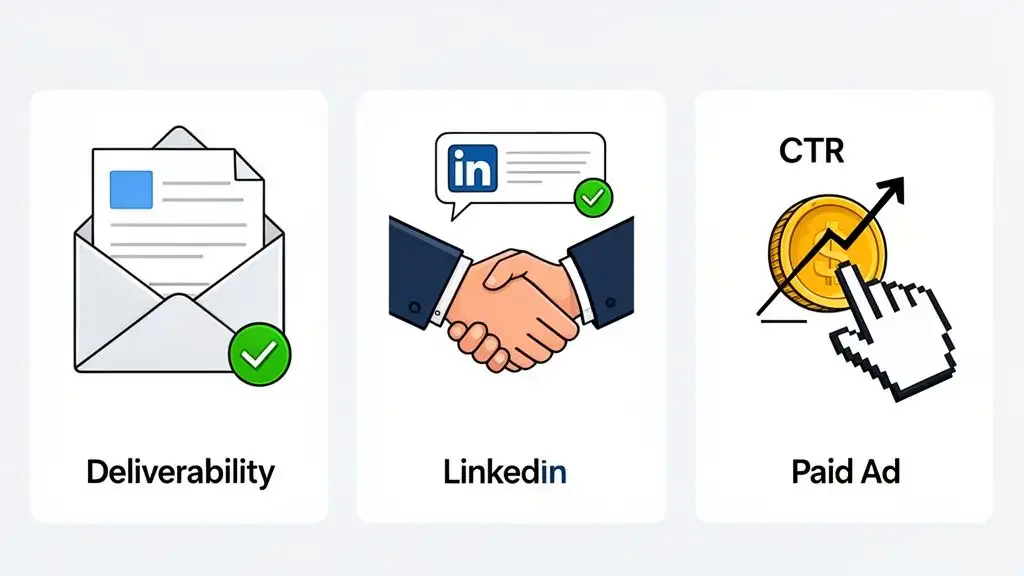
Email KPIs That Actually Matter
For too long, sales teams have been obsessed with open rates. But with all the privacy updates and automatic email previews, "opens" have become a ghost metric. It's fuzzy, unreliable, and mostly useless. It's time to focus on what truly signals that a real human is on the other end.
The game really begins with Email Deliverability. Think about it: if your carefully crafted emails are landing in the spam folder, you might as well have written them on a napkin and thrown them into the wind. Nothing else matters.
-
Bounce Rate: This is the percentage of your emails that hit a digital brick wall and never even made it to the recipient's server. A hard bounce means the email address is a dud. A high bounce rate (anything over 5%) is like a scarlet letter for your domain, signaling to email providers that you're a spammer.
-
Reply Rate: This is the one. The holy grail. A real person read your message and took the time to write back. It's the ultimate proof that your targeting is sharp, your personalization is on point, and your message actually resonates. For cold outreach, a good reply rate is somewhere in the 5-10% range.
Your data provider absolutely must deliver a 95%+ email accuracy rate. Anything less is a waste of money and a fast track to getting your domain blacklisted. This isn't just a nice-to-have; it's the price of entry for playing the email game.
This is exactly the problem platforms like Munch were built to solve. They provide verified, up-to-the-minute contact data so you can be confident your messages are actually landing in a real inbox.
Pro Tip: Use Munch to enrich your contact data and get accurate work email ids and validate them in waterfall motion.
Winning with LinkedIn KPIs
LinkedIn is the B2B sandbox, but let's face it, most people are just throwing sand. Firing off a generic, copy-pasted connection request is the digital equivalent of walking into a networking event and immediately asking a stranger for a loan. It’s just plain awkward, and it never, ever works.
If you want to win on LinkedIn, you need to track the KPIs that measure genuine connection and conversation.
-
Connection Request Acceptance Rate: This tells you if your first impression is landing. Are you coming across as a trusted advisor or a spammy bot? A high acceptance rate (you should be aiming for 30% or higher) means your profile is polished and your initial message feels personal.
-
Reply Rate to InMail/Messages: The real work starts after they click "accept." This KPI shows how many of your new connections actually want to talk to you. A lazy "thanks for connecting, want a demo?" message will get you sent straight to digital purgatory.
Make no mistake, LinkedIn is a beast in the B2B world. A whopping 40% of marketers name LinkedIn as their top channel for netting high-quality leads. On top of that, it boasts a cost per lead (CPL) that's 28% lower than Google AdWords, which means you can do more with your budget.
Paid Channel KPIs for Maximum ROI
When you're paying for every single click, there’s zero room for fluff. Paid channels like Google Ads or LinkedIn Ads are all about ruthless efficiency. The whole point is to spend your money talking only to the people who fit your Ideal Customer Profile (ICP). For a deeper dive, check out our guide on outbound lead generation methods.
In the world of paid ads, two KPIs rule them all:
-
Click-Through Rate (CTR): What percentage of people who saw your ad actually bothered to click it? A low CTR is a clear sign that your message or creative is falling flat. You're essentially shouting into a void, and no one is listening.
-
Cost Per Acquisition (CPA): This is the bottom line. The CPA tells you exactly how much money it costs to get one person to do the thing you want them to do, like book a demo or download a whitepaper. It’s the ultimate report card for your ad spend.
Optimizing your paid channels is a constant process of refining your targeting to laser-focus on your ICP. A high CPA is often a symptom of bad targeting. You're paying for clicks from people who were never going to buy from you in the first place.
Common KPI Pitfalls and How to Fix Them
So you’re tracking your lead gen KPIs. Fantastic. But just having the data is like owning a box of the world's best ingredients. If you don't know the recipe or how to cook, you're just staring at a bunch of expensive groceries. Data without action is just trivia.
Too many teams fall into the same old traps, mesmerized by flashy dashboards but completely failing to connect the dots. They pop the champagne over a flood of new leads while the sales team is quietly starving for real, actual opportunities.
Let's break down the most common pitfalls and, more importantly, how to climb out of them for good.
Pitfall 1: The Volume Over Quality Trap
This one's a classic. You become obsessed with cramming the top of your funnel, so you celebrate a massive Lead Volume and a ridiculously low Cost Per Lead (CPL). Your reports look incredible. The only problem? Your MQL-to-SQL conversion rate is in the gutter, and your sales team is spending 80% of its day disqualifying junk.
It’s like ordering a thousand pizzas for a party and discovering they're all just cardboard discs with ketchup smeared on them. Sure, you got a lot for your money, but nobody’s eating.
How to Fix It:
-
Refine Your ICP: Get surgically precise with your Ideal Customer Profile. Don’t stop at company size and industry. Dig deeper into technographics, recent buying signals (like a new exec hire), and company growth trends.
-
Implement Lead Scoring: Stop treating every lead like they're created equal, because they're not. Score leads based on a mix of firmographics and, this is crucial, their behavior. A prospect who visits your pricing page twice is leagues more valuable than someone who just downloaded a top-of-funnel ebook.
-
Focus on Pipeline Created: Make this metric your North Star. A smaller number of high-quality leads that generate significant pipeline is always better than a tidal wave of tire-kickers.
Pitfall 2: The Disconnected Data Silo Problem
Sound familiar? Marketing has their data in one system, sales has theirs in a CRM, and your ad platforms are their own lonely little islands. Nothing talks to each other. The result is a mess. You have no single source of truth and can’t see the full customer journey from start to finish.
This is the business equivalent of the characters in Friends never talking to each other outside of Central Perk. How would they ever know what's going on? You can't attribute a closed deal to that webinar six months ago if your systems are strangers.
Data silos are where good leads go to die. When marketing can't see which leads turn into revenue, they can't optimize their campaigns. When sales doesn't have the context from marketing, every call is a cold one.
How to Fix It:
The fix is to centralize and enrich your data. Tools that offer data enrichment automatically fill in the blanks on your leads, adding crucial details like verified emails, direct dials, and up-to-date company info right into your CRM. To really get a handle on this, check out our deep dive on what data enrichment is and how it smashes these silos to pieces.
Pitfall 3: The "Set It and Forget It" Mindset
You launched a campaign, set up your KPIs, and now you’re just letting it run, maybe peeking at the dashboard once a month. This hands-off approach is a surefire recipe for wasted budget and missed opportunities. The market simply moves way too fast for that.
With the lead gen market valued at $3.1 billion in 2021 and projected to hit $15.5 billion by 2031, standing still means you're actually moving backward. The top-performing businesses aren't passive; they’re actively using AI and real-time data to gain an edge, reporting 50% more sales-ready leads and slashing acquisition costs by up to 60%. You can learn more about how lead generation is evolving from this research.
How to Fix It:
-
A/B Test Everything: Always be testing. Your subject lines, your ad copy, your landing pages, your calls-to-action. The killer campaign that worked last quarter might be totally stale now.
-
Review KPIs Weekly: Hold a weekly meeting to go over your lead gen KPIs. Look for trends. Why did the meeting-booked rate dip last Tuesday? What caused that spike in reply rates on Thursday?
-
Act on the Data: Don't just admire the numbers. If a channel is underperforming, reallocate the budget. If a message isn’t getting replies, scrap it and write a new one. Turn your insights into immediate action.
Your Burning Questions About Lead Gen KPIs, Answered
Alright, we've covered a ton of ground on lead gen KPIs, the formulas, the pitfalls, the weird quirks for different channels. But let's be honest, the real questions always pop up when you're actually in the trenches, trying to make sense of the numbers.
Think of this as your personal Q&A round. I'm tackling the most common questions I hear from sales pros, from fresh-faced SDRs to seasoned VPs. Let's clear up any lingering confusion with some straight-up, no-fluff answers.
What Are the Most Important Lead Gen KPIs for a B2B Startup?
For a B2B startup, every dollar and every minute is precious. You don't have the luxury of chasing vanity metrics that look good on a slide but don't pay the bills. You need to focus on the KPIs that prove your sales engine isn't just sputtering along, but is ready to hit the gas.
It's all about showing investors (and yourself) that you've built a predictable growth machine.
Forget about high-fiving over raw lead volume. Zero in on these three power metrics instead:
-
MQL to SQL Conversion Rate: This is your quality control checkpoint. It answers the question, "Is our marketing actually attracting the right people?" A healthy rate here is proof that your go-to-market strategy is hitting the mark and your definition of a "good lead" isn't a fantasy.
-
Pipeline Created: This is the most direct signal of future revenue, period. It's the total dollar value of the real, qualified opportunities your team has unearthed. This is the number that gets you funding and keeps the lights on. It's the language investors speak.
-
Lead Velocity Rate (LVR): Think of this as your pipeline's growth rate. LVR measures the month-over-month increase in your qualified leads. A consistently rising LVR is a massive green flag, signaling that your growth isn't a fluke but a repeatable, scalable process.
How Often Should I Track My Lead Gen KPIs?
Staring at your dashboard 24/7 is a surefire way to drive yourself crazy, but checking in once a quarter is like checking the smoke alarm after the house has burned down. The right rhythm depends entirely on the metric and where it sits in your funnel.
It's like cooking a good pot of chili. You stir it frequently at the beginning to keep things from burning, then let it simmer, checking less often as the flavors come together.
A classic mistake is treating all KPIs with the same frantic urgency. Tracking your Cost Per Acquisition daily will give you whiplash from meaningless ups and downs. But reviewing lead volume only quarterly means you could miss a massive campaign failure for three whole months.
Here’s a practical schedule that works:
-
Daily or Weekly: Keep a close eye on your top-of-funnel KPIs that give you a real-time pulse on campaign health. This includes things like Lead Volume, Visitor-to-Lead Conversion Rates, and Initial Reply Rates. These are your canaries in the coal mine. They’ll give you an early warning if something’s gone wrong.
-
Weekly or Bi-Weekly: Review mid-funnel metrics like your MQL to SQL Rate. This gives leads enough time to actually move through the initial qualification steps, so you're looking at a stable, meaningful trendline instead of just noise.
-
Monthly and Quarterly: This is the time to analyze your big-picture, strategic KPIs. Dig into your Pipeline Created, Cost Per Acquisition (CPA), and Lead Velocity Rate (LVR). Looking at these over a longer horizon helps you spot meaningful trends and make smart strategic calls without overreacting to daily fluctuations.
We Get Lots of Leads but Few Close. What KPI Should I Check First?
Ah, the classic. This is an incredibly common and incredibly frustrating problem. Your funnel is packed, but your bank account is empty. It feels like you're running a popular, but free, amusement park instead of a business.
When you're swimming in leads but drowning in low close rates, there's one KPI you need to put under a microscope immediately: MQL to SQL Conversion Rate.
This single metric is the critical bridge between what marketing is doing and what sales needs. A low conversion rate here is almost always the epicenter of the problem. It's where lead quality issues become glaringly obvious and impossible to ignore. Think of it like a scene from CSI; this is where the evidence of the crime is most concentrated.
A broken MQL-to-SQL process points to a fundamental mismatch between the people marketing is attracting and the people sales can actually sell to. Ask yourself:
-
Are you targeting the wrong Ideal Customer Profile (ICP)? Your ads might be brilliant, but if they're pulling in an audience that can't afford or doesn't need your product, you're just spinning your wheels.
-
Is your definition of a "qualified lead" a joke? If marketing's idea of "hot" is sales' definition of "ice cold," you've got a communication breakdown, not a lead problem.
-
Are leads missing crucial data? If your reps have to spend 20 minutes just to find a direct phone number, they'll disqualify otherwise good leads out of pure frustration.
Fixing this one KPI will send a massive, positive ripple effect through your entire sales funnel. When sales starts getting leads they're genuinely excited to talk to, your demo-booked rates, pipeline velocity, and, most importantly, your close rates will all start climbing.
Ready to stop guessing and start targeting high-intent prospects with surgical precision? Munch is the sales intelligence platform that unifies lead discovery, data enrichment, and AI personalization into a single, powerful workflow. Find buyers showing real-time intent, enrich their data with 95%+ email accuracy, and generate outreach that actually gets replies.